


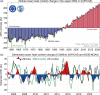
Figure: (upper) The global upper 2000 m OHC from 1958 through 2021. The histogram presents annual anomalies relative to a 1981–2010 baseline, with positive anomalies shown as red bars and negative anomalies as blue. Units: ZJ. (bottom) Detrended OHC time series from 2005 to 2021 compared with ONI index.
The...