CORE I
To investigate the climatological ocean and sea-ice states realised through multi-centennial simulations forced by idealised repeating normal year forcing that has been derived from 43 years of interannually varying forcing, retaining synoptic variability with a seamless transition from 31 December to 1 January (Large and Yeager, 2004).
After being initially proposed in 2004, CORE-I has now reached a critical mass with a community-wide proof of concept approval and seven ocean-ice models (see Table 1) that have been run for 500 years with the repeat 'normal year forcing' of Large and Yeager (2004). This is a significant step forward from 2005 when only three geopotential modelling groups were involved. The experiment has yielded a wide variety of results, with more questions raised than answered. Broad comparison projects such as this achieve much in this way by raising questions, which then motivate further research. Without such a comparison, questions would remain unasked, and thus unanswered. A peer-review paper with 24 authors (Griffies et al., 2009) published in Ocean Modelling.
Table 1: Models that have taken part in CORE-I:
|
Model |
|
Model release |
|
NCAR-POP |
|
POP1.4 and CSIM4 |
|
FSU-HYCOM |
|
HYCOM 2.2 and CSIM4 |
|
GFDL-MOM |
|
MOM4p0d |
|
GFDL-HIM |
|
HIM-Fortran M-release |
|
KNMI-MICOM |
|
MICOM 2.9 |
|
MPI |
|
mpiom-1.2.3 |
|
Kiel-ORCA |
|
NEMO 1.06 |
CORE-I Model Evaluation
The comprehensive suite of diagnostics used to evaluate CORE I simulations are presented here as a WGOMD guideline for how to assess global ocean and ice simulations using observational datasets. The choice of diagnostics and observations is systematically discussed in Griffies et al. (2009).
|
1/ Globally averaged ocean temperature and salinity with time. Assuming no internal sources or sinks, this depends on air-sea and ice-sea exchange and is a diagnostic for model drift. 2/ Horizontally averaged temperature and salinity with time. Annual mean anomalies relative to observations (World Ocean Database 2005 (Boyer et al., 2006), PHC Global Ocean Hydrography (Steele et al., 2001) show the evolution of biases throughout water column. 3/ Global maps of SST and SSS bias. Annomalies relative to observations (World Ocean Database 2005 (Boyer et al., 2006), PHC Global Ocean Hydrography (Steele et al., 2001) for the Arctic). 4/ Annual cycle of heat content (vertically integrated temperature) over the upper 250m and SST at Ocean Weather Ship Echo (in the subtropical Atlantic at 35N, 48W), compared to observations (World Ocean Database 2005 (Boyer et al., 2006)). Monthly values are diagnosed, defining hysteresis loops characterizing the seasonal cycle of the near-surface thermal properties. 5/ Sea ice concentrations (area of sea ice per grid cell area) compared to satellite sea ice concentration climatology for the years 1979-2004 compiled by Comiso (1999, updated 2005). Temporal evolution of annual mean sea ice area in both Hemispheres and maps of maximum sea ice area (March and September for the Northern and Southern Hemispheres, respectively). 6/ Equatorial Pacific upper ocean temperature and zonal velocity evaluation. Comparison to isopycnal analysis by Johnson et al. (2002). 7/ Mixed layer depths. For a global estimate of mixed layer depth, an observed estimate is used that is derived from a long-term monthly mean climatology of <theta - S> from the World Ocean Atlas (Locarini et al., 2006, Antonov et al., 2006). 8/ Global zonal average potential temperature and salinity anomalies in latitute and depth plane, compared to observations (World Ocean Database 2005 (Boyer et al., 2006), PHC Global Ocean Hydrography (Steele et al., 2001) for the Arctic), as a means to evaluate water mass formation processes. England and Maier-Reimer (2001) show that CFC and radiocarbon can also be used in this context. 9/ Vertically integrated volume transport through the Drake Passage. The Drake Passage transport has been measured using various methods, with a low value of around 100Sv (Orsi et al., 1995) and a high value of 135Sv (Cunningham et al., 2003), and a range of 134+/-13Sv (Whitworth, 1983; Whitworth and Peterson, 1985). 10/ Poleward heat transport. There are ambiguities as to the choice of which atmospheric product should be used to calculate the implied heat transport (e.g. see Taylor, 2000). See the discussion in Griffies et al. (2009) on two different approaches to calculate the implied heat transport. 11/ Meridional overturning streamfunction. The North Atlantic thermohaline circulation is examined in the Atlantic MOC streamfunction, while the Southern Ocean thermohaline circulation is examined in the global streamfunction. |
Results from 500yr CORE-I integrations
Many models performed similarly in tropics (though with notable outliers). Otherwise, there are major differences, which mainly point to differences in model configurations and algorithms. Figures 1 and 2 illustrate some important results from the CORE-I integrations on the simulation of the Atlantic thermohaline circulation. A stable meridional overturning circulation with a realistic transport strength and structure is important for maintaining a realistic ocean climate. Figure 1 shows the different behavior exhibited by different models, with some stabilizing relatively quickly (eg KNMI-MICOM, though to an extremely weak, almost absent overturning circulation) while others taking over 500 years to stabilize (GFDL-MOM, which was confirmed to have stabilized when the integration was extended to 600 years); and the GFDL-HIM simulation possess multi-centennial variability which is too long to assess with a 500 year run.
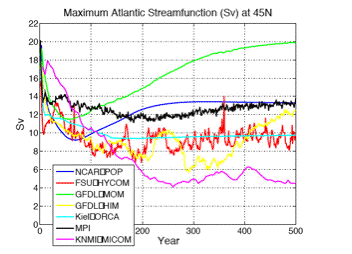
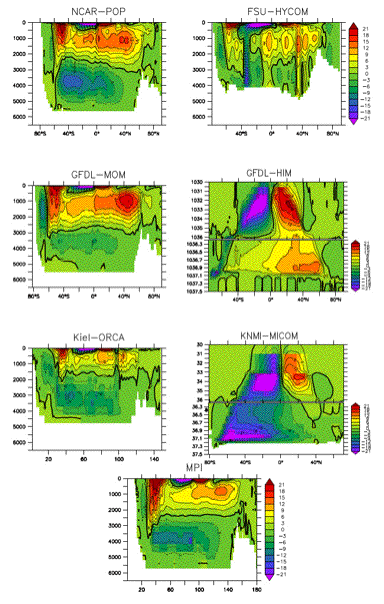
Figure 2 shows the global meridional overturning streamfunction averaged over model years 491-500. The FSU-HYCOM streamfunction has been interpolated to depth based coordinates, leading to noisy results. The GFDL-HIM and KNMI-MICOM streamfunction is kept on its native potential density coordinates and the figures are split into upper and lower plots to distinguish the Ekman-driven cells in the upper layer and the overturning cells in the deep ocean. The NADW cell is almost absent in the KNMI-MICOM simulation. All the z-level models have a realistic AABW cells of 5-10Sv, while the isopycnal models show much stronger overturning in the South.
Figure 1: Time series of the annual mean Atlantic meridional overturning streamfunction (Sv = 106m3s-1). The index is computed as the maximum Atlantic MOC streamfunction at 45oN in the region beneath the Ekman layer (Griffies et al, 2009).
Figure 2: The global meridional overturning streamfunction (Sv = 106m3s-1), time averaged over the model years 491-500. The GFDL-HIM and NMI-MICOM results are plotted on the original potential density coordinates referenced to 2000db (1035-rho2000) (Griffies et al, 2009).
Difficulties in establishing a stable climate simulation with reasonable biases using the MICOM code, KNMI investigators decided to transfer their efforts to the French geopotential model OPA, also represented by Kiel in the CORE-I study. This code conversion represents a major decision for the KNMI team, and is a nontrivial outcome of the CORE-I project.
Some groups were not able to maintain a quasi-stable MOC for the CORE-I multi-centennial simulations without applying a non-trivial salinity restoring, also necessary to damp drifts in deep water mass properties. The participating groups were given the freedom to choose their own salinity restoring depending on each model's sensitivity. For example, CCSM maintained a globally weak salinity forcing with a piston velocity of 50m/4yrs; GFDL-MOM strengthened the restoring to 50m/300days; and KNMI and ORCA using stronger restoring in certain high latitude regions. Details are given in Griffies et al. (2009).
Some participating groups ran extra simulations to examine the sensitivity to the choice of salinity restoring. Figure 3 shows the annual mean volume transports across 45oN in the North Atlantic and across the Drake Passage for two MPI and GFDL-MOM simulation, one with weaker restoring (50m/4yr) and one with stronger restoring (50m/300days). The GFDL-MOM-A weak restoring simulation (left, black line) develops a series of growing amplitude multi-decadal oscillations after 250 year, demonstrating the need for multi-centennial simulations to evaluate the stability of the overturning circulation. This sensitivity led to the strong restoring experiment (GFDL-MOM-B) being chosen as the standard experiment that contributed to the CORE-I evaluation. The MPI model is less sensitive to the choice of salinity restoring. Even though the weaker restoring experiment (MPI-A) exhibited greater amplitude variability in the Drake Passage, this was the preferred experiment for the rest of the CORE-I evaluation.
Figure 3: Timeseries of the annual mean volume transports (Sv=106 m3 s-1) from two MPI (left) and two GFDL-MOM (right) simulations. The black lines are from ocean-ice (MPI-A and GFDL-MOM-A) simulations with a weak salinity restoring of 50m/4yr piston velocity and the blue lines are for simulations with a stronger salinity restoring of 50m/300days piston velocity (MPI-B and GFDL-MOM-B). The top panels show the maximum meridional overturning streamfunction at 45oN and the bottom panels show the eastward transport through the Drake Passage (Griffies et al, 2009).

Results from other additional Kiel-ORCA simulations indicate that the MOC solution is dependent on the drift in overflow density (not convection in the Labrador Sea). The drift in transport arises after about 200 years of integration and is related to a progressive freshening of intermediate waters in the Nordic Seas. This dependence will therefore be closely related to the choice of precipitation and river run-off, as well the choice of SSS restoring.
Hypotheses for model sensitivity to salinity forcing:
- The Large and Yeager (2004) dataset has overly strong precipitation in the Arctic and high latitude Atlantic.
- Annual mean river input over full year should be switched to more realistic seasonal cycle.
- Stable models (CCSM and MPI, with displaced pole placing fine resolution near Lab Sea) may resolve Atlantic currents better, reducing the ability of fresh Arctic water from halting the THC by advecting fresh water faster through convection regions.
- Weak SSS restoring places some models to one side of the mixed boundary condition instability, and other models to the other side.
- Full answer may be a combination of the above.
Initial results on the sensitivity of the MOC solution to model resolution indicate that models with a finer horizontal resolution (in the North Atlantic Ocean) are less sensitive to SSS restoring and can have a stable MOC with weak restoring. R. Greatbatch points out that the models are existing close to instability related to mixed boundary conditions. CORE-I experiments, perhaps initially of 200 years, could be run at different resolutions to test the robustness of the solutions.
In conclusion, the CORE-I results have highlighted the limitations of forcing ocean-ice models with a non-responsive atmosphere. This experimental setup led to an exaggeration of the effect of positive feedback mechanisms on the MOC prompting the use of stronger SSS restoring by most groups.
References
Papers using the CORE NYF data sets

